
Full Text · HTML
3,023 words · about 14 min read · open access under CC BY 4.0
Contents
Abstract
Manned aircraft and unmanned aerial vehicles (UAVs) now share the same airspace, yet existing systems either track only manned aircraft (ATC radar and ADS-B receivers) or detect only drones (counter-UAS RF scanners), and no affordable system correlates both to estimate collision risk in real time. This paper presents SkyGuard, a software-based airspace risk-scoring system that fuses Automatic Dependent Surveillance–Broadcast (ADS-B) aircraft data with radio-frequency (RF) based UAV detection data into a unified airspace model. A weighted algorithm computes a dynamic risk index from 0 to 100 using proximity, closest-point-of-approach convergence and aircraft altitude-band severity, scaled by detection confidence; a classification layer (CNN with Remote ID cross-referencing) is designed to distinguish authorized drones from unauthorized or hostile ones; and a four-tier alert scheme (Advisory, Caution, Warning, Emergency) notifies operators through a live web dashboard with a map-based risk overlay. The work covers the complete software pipeline using simulated and dataset-based RF inputs, with physical sensor integration planned as a later phase. SkyGuard demonstrates a low-cost, passive and legally compliant approach to airspace situational awareness for airports, border security, critical infrastructure and public events.
I. INTRODUCTION
Drones (unmanned aerial vehicles, UAVs) have quickly grown from a hobbyist pastime into a working tool for delivery, surveying, agriculture, emergency response and security tasks, and their numbers rise each year. Airliners and general aviation aircraft fly in the same airspace, particularly near airports and along approach paths. Sharing the sky in this way introduces a new kind of hazard: mid-air collisions, near-misses and deliberate hostile intrusions.
Real incidents illustrate the scale of the problem. Drone sightings at London Gatwick Airport in 2018 shut the airport for roughly 33 hours, cancelled more than 1,000 flights and disrupted about 140,000 passengers [1]. Pilots also report over 100 drone near-misses to the FAA every month [2]. Beyond safety, drones are increasingly used for smuggling and surveillance, and reported drone incursions have climbed steeply since 2020.
Current technology covers only one half of the problem. ADS-B and ATC systems follow manned aircraft but are blind to drones, because drones do not transmit ADS-B Out. Counter-UAS systems find drones using RF, radar or acoustic sensing [3], yet they do not know which manned aircraft are nearby and so cannot tell how dangerous a particular drone is. Most such systems are also priced for enterprise or military customers.
SkyGuard is built to close this gap. It is a software platform that brings ADS-B aircraft data and RF-based drone detections together into one airspace picture and calculates a live weighted risk score from 0 to 100 for the monitored zone. The score drives tiered alerts and a live dashboard, allowing operators to respond in proportion to the real level of risk. The system is entirely passive: it only receives and analyses signals and never transmits or jams, which keeps it legally compliant. Its main objectives are:
- to fuse ADS-B aircraft data with RF-based UAV detection data in one software system;
- to compute a dynamic, weighted airspace risk score (0–100) in real time;
- to design a classification layer that labels detected drones as authorized or unauthorized using machine learning and Remote ID cross-referencing;
- to issue four-tier alerts (Advisory, Caution, Warning, Emergency) and present aircraft, drones and risk zones on a live map-based dashboard.
This work covers the whole software pipeline: data ingestion, fusion, risk-score computation, AI-based threat classification, alert generation and visualization. Live ADS-B data comes from online services such as the OpenSky Network API and from recorded flights, whereas drone RF detections are supplied by simulated and dataset-based inputs. Physical sensing hardware (SDR receivers, RF sensors and edge devices) lies outside the current phase and is covered as future work in Section VI.
II.RELATED WORK
Airspace safety has historically evolved along two separate lines: air traffic management for manned aircraft and counter-UAS detection for drones. The FAA UAS Traffic Management (UTM) framework governs drone operations, notably beyond visual line of sight, using flight plans submitted to approved service suppliers and airspace constraints shared digitally [2], [4]. UTM enables strategic deconfliction among registered drones, but it cannot see unregistered or rogue drones and provides no real-time risk score for conflicts in flight.
Commercial counter-drone platforms such as Dedrone by Axon integrate RF analysers, radar, cameras and acoustic sensors with AI classification and are used at large events and sensitive sites [1]. They detect drones well, but they do not follow manned aircraft through ADS-B and therefore cannot estimate aircraft–drone collision risk; they are also sold to enterprise or government buyers. Military-grade systems such as CRFS RFeye, used within Rafael’s Drone Dome, depend on wideband passive RF sensing from 70 MHz to 6 GHz with TDoA/AoA techniques for 3D geolocation [5], while Sentrycs v6.0 and its Horizon Engine apply AI- based spectrum analysis to recognise unknown drone protocols without a stored signature library [6]. Both concentrate on detecting or neutralising threats rather than preventing civil airspace collisions.
Other systems address only part of the picture. uAvionix SkyLine uses ADS -B and multi-datalink information for aircraft, Indra’s Detect-and-Avoid system relies on radar and sensor fusion, and Vyomkavach from Zen Technologies combines RF, radar and EO/IR sensing for counter-drone defense [7], [8]. None of them offers a unified ADS-B plus RF risk-scoring engine at low cost.
Studies show that drone control and video links in the 2.4 GHz and 5.8 GHz bands can be fingerprinted and classified with machine learning [9]. Surveys of UAV operational safety and airspace risk stress the need for systematic risk assessment as drone traffic grows [10], [11], and industry reports identify RF -silent autonomous drones as a growing blind spot for RF-only approaches [12]. Table I compares existing systems with the proposed one.
| System | Aircraft | Drones | Risk score | Cost | Gap |
|---|---|---|---|---|---|
| FAA UTM | Limited | Registered only | No | Govt. infra | Rogue drones invisible |
| Dedrone (Axon) | No | Yes | No | Very high | No aircraft awareness |
| DroneShield | No | Yes | No | Very high | No aircraft awareness |
| CRFS / Drone Dome | No | Yes | No | Military | No civil airspace context |
| Sentrycs v6.0 uAvionix SkyLine | No Yes | Yes No | No No | Very high High | No ADS-B integration No drone detection |
| Indra DAA | Yes | Partial | No | Very high | No unified score |
| SkyGuard (proposed) | Yes | Yes | Yes | Low cost | RF-silent drones (future) |
| This review reveals three research gaps: (i) no existing platform combines ADS system, (ii) no system provides a real solutions are too expensive for regional airports | -time numerical risk score that operators can act on, and (iii) most, event venues and smaller agencies. SkyGuard addresses | -B and RF data in one |
these gaps by combining data fusion, weighted risk scoring and AI classification in a single low-cost software platform.
III. SYSTEM ARCHITECTURE
The system operates as a continuous real-time loop across four functional layers: Input, Process, Classify and Output. Fig. 1 shows the architecture of the SkyGuard software system.
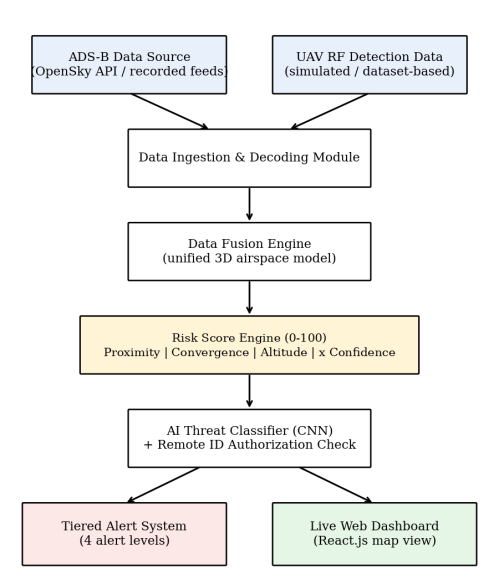
Aircraft data arrives from an ADS-B source and drone detection data from the RF detection source. The ingestion module decodes and validates both streams, and the data fusion engine places aircraft and drones into one unified 3D airspace model. The risk score engine evaluates every drone–aircraft pair and produces a score from 0 to 100, the classification layer assesses whether each drone is authorized or hostile, and the alert system and live dashboard present the outcome to operators.
A. Working of the System
- ADS-B messages (position, altitude, velocity, heading, flight ID) are received for manned aircraft, and RF detection records (frequency band, signal strength, estimated position, signature features) for drones.
- The ingestion module cleans, timestamps and synchronizes both streams, and the fusion engine merges them into a unified airspace model.
- The risk score engine computes the proximity, convergence and altitude -severity terms and the detection-confidence-scaled risk index.
- The classification layer labels each drone as authorized or unauthorized using RF fingerprint features and Remote ID cross-referencing; it is a separate extension and not a term of the score.
- The alert system assigns an alert tier from the risk score and notifies operators; the dashboard shows aircraft, drones, risk zones and trajectories on a live map.
B. Risk Score Formula
The implemented risk score R combines three normalised terms and scales their weighted sum by a detection-confidence factor:
R = 100 × Fconf × (0.45P + 0.35C + 0.20Aalt) (1)
where P is proximity (current separation, reduced by positional uncertainty), C is convergence (closest- point-of-approach geometry and whether the separation is worsening), Aalt is aircraft altitude-band severity relative to local ground elevation, and Fconf is the detection-confidence factor, bounded below by a configured confidence floor and above by 1.0, so that a weak RF detection is attenuated rather than erased. The implemented weights are 0.45, 0.35 and 0.20, respectively (Table II).
Term Weight Description Current separation between aircraft and drone, including positional Proximity (P) 45% uncertainty Closest-point-of-approach geometry and whether separation is Convergence (C) 35% worsening Altitude severity (Aalt) 20% Aircraft altitude-band severity relative to local ground elevation
C. Alert Tiers
The risk score is mapped to four alert tiers using the configured thresholds: caution at 25, warning at 50 and emergency at 75, as listed in Table III.
| Alert level | Risk score Action |
|---|---|
| ADVISORY | 0–24.99 Monitor; score is below the caution threshold. |
| CAUTION | 25–49.99 Notify operator and increase monitoring. |
| WARNING | 50–74.99 Issue warning and prompt operator review. |
| EMERGENCY | 75–100 Trigger emergency escalation protocol. |
IV. METHODOLOGY
The methodology follows a structured, phase-wise approach so that the system remains accurate, modular and scalable. It is implemented using Python-based data processing, machine learning and web technologies. Fig. 2 shows the overall methodology flow.
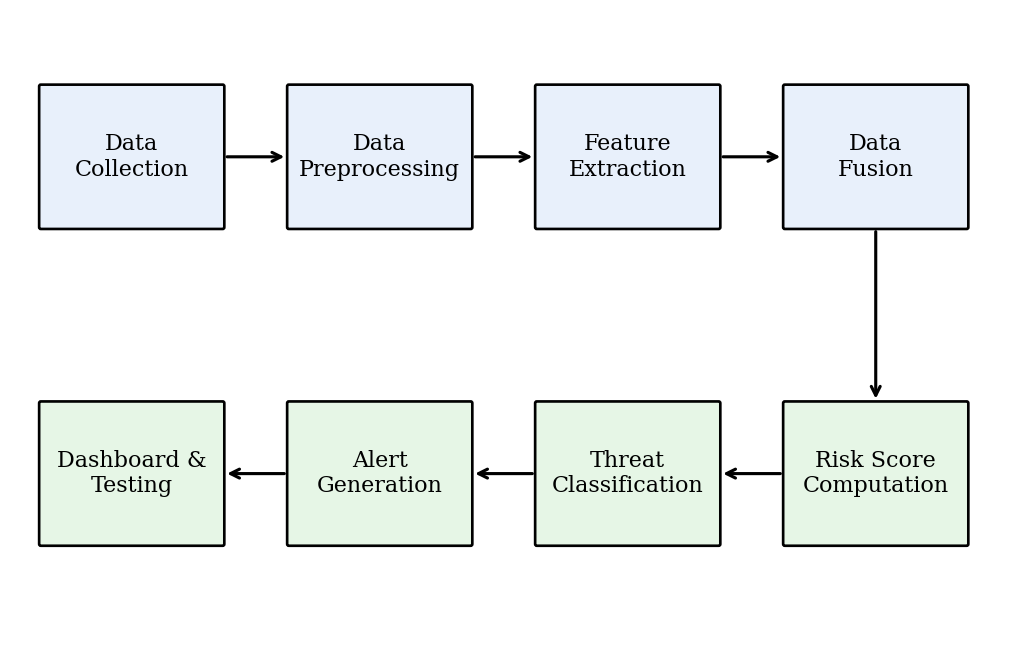
A. Data Collection
Two types of data are used. ADS-B aircraft data (position, altitude, speed, heading and identification) is collected from online services such as the OpenSky Network API and from recorded flight data. Drone RF detection data is prepared from publicly available RF drone datasets and simulated drone scenarios covering the 2.4 GHz and 5.8 GHz bands, including both authorized and unauthorized drone behavior. Simulated conflict scenarios (converging, diverging and loitering drones near aircraft approach paths) are used to validate the risk algorithm.
B. Data Preprocessing
Raw records are cleaned by removing duplicates, invalid coordinates and incomplete messages.
Timestamps are synchronized across the two streams, coordinates are converted into a common reference frame, and values such as altitude and speed are normalised to consistent units. RF signals are converted into feature representations suitable for the classifier.
C. Data Fusion
The fusion engine merges aircraft tracks and drone detections into a unified 3D airspace model using NumPy, SciPy and Pandas. Each entity is stored with position, velocity and heading, and tracks are updated continuously so that distances and relative motion between every drone and aircraft can be computed in real time.
D. Risk Score Computation
For each drone–aircraft pair, the engine calculates the current separation (reduced by positional uncertainty), the closest point of approach and the time to reach it, whether the separation is worsening, and the aircraft’s altitude band relative to local ground elevation. Short-term trajectory prediction extends current motion forward in time so that converging paths are recognised before the drone enters the danger zone. The three terms are combined with the weights in Table II and scaled by the detection-confidence factor to obtain the final risk index. When several drones are present, a score is computed for every drone–aircraft pair and the highest-risk pair is shown to the operator, so that one dangerous pair is not hidden by many safe ones.
E. Threat Classification
A convolutional neural network (TensorFlow/PyTorch) is designed to be trained on RF fingerprint features to identify the drone type and detect abnormal behavior. The result is to be cross-referenced with Remote ID information to decide whether the drone is authorized, unregistered or potentially hostile. In the current implementation this classification is a separate layer and is not a term of the risk score equation.
F. Alert Generation and Dashboard
Alerts are pushed to operators in real time through WebSockets or MQTT messaging. The backend (FastAPI/Flask) serves the processed data to a React.js dashboard that uses Leaflet or Mapbox to show aircraft, drones, risk zones and trajectories, and flight tracks and risk history are stored in a time-series database (InfluxDB). The full software stack is summarised in Table IV.
| Layer | Technology | Role |
|---|---|---|
| Data ingestion | Python, OpenSky API, recorded data | Receive and decode ADS-B and RF detection records |
| Data fusion | NumPy, SciPy, Pandas | Merge aircraft and drone spatial data |
| Risk algorithm | Custom Python / ML model | Compute weighted risk score |
| AI classification | TensorFlow / PyTorch CNN | Classify drone type from RF fingerprint |
| Backend API | FastAPI / Flask | Serve risk data to dashboard and alerts |
| Frontend | React.js, Leaflet / MapboxGL | Real-time map with risk overlay |
| Database | InfluxDB | Store tracks and risk history |
| Alerts | WebSockets / MQTT | Push alerts to operators |
G. Testing
The system is tested with different airspace scenarios: no drone present, a distant authorized drone, a drone converging with an aircraft, a drone loitering near an approach path, and multiple simultaneous drones. Tests check that the risk score rises and falls correctly with proximity and convergence, that alert tiers trigger at the right thresholds, and that the dashboard updates in real time. Observations from testing are used to tune factor weights and classifier thresholds.
V. RESULTS AND DISCUSSION
A. Results
The system successfully ingested aircraft and drone detection data, fused them into one airspace model and produced a live risk score for the monitored zone. The score responded as expected to changing conditions: it increased when a drone moved closer to an aircraft or when the paths converged, and decreased when the drone moved away or diverged. Alert tiers were triggered according to the defined score ranges. The web dashboard displayed aircraft, drones, risk zones and alert status on a live map, allowing the operator to understand the airspace situation at a glance without manual calculation. Key observed results are a unified view of manned aircraft and drones in a single platform, a real-time risk score from 0 to 100, proportionate four-tier alerts instead of a simple detect/no-detect output, and reduced manual threat-assessment effort for the operator.
B. Score Decomposition from the Demonstration Scenario
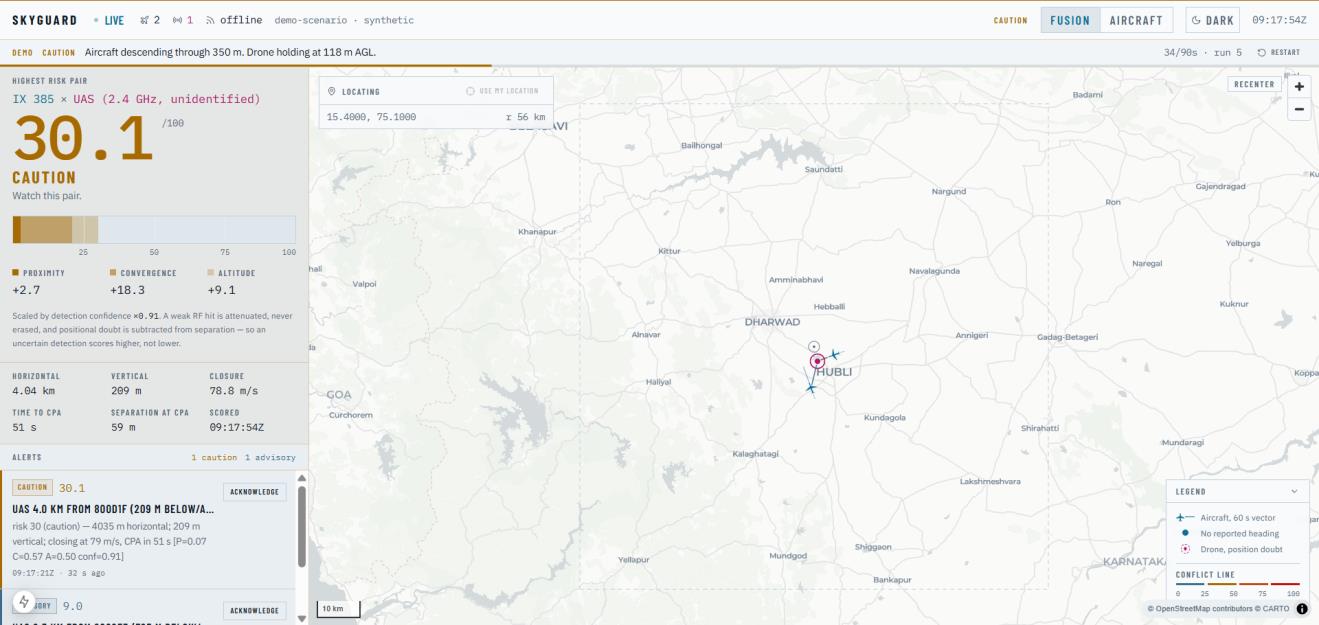
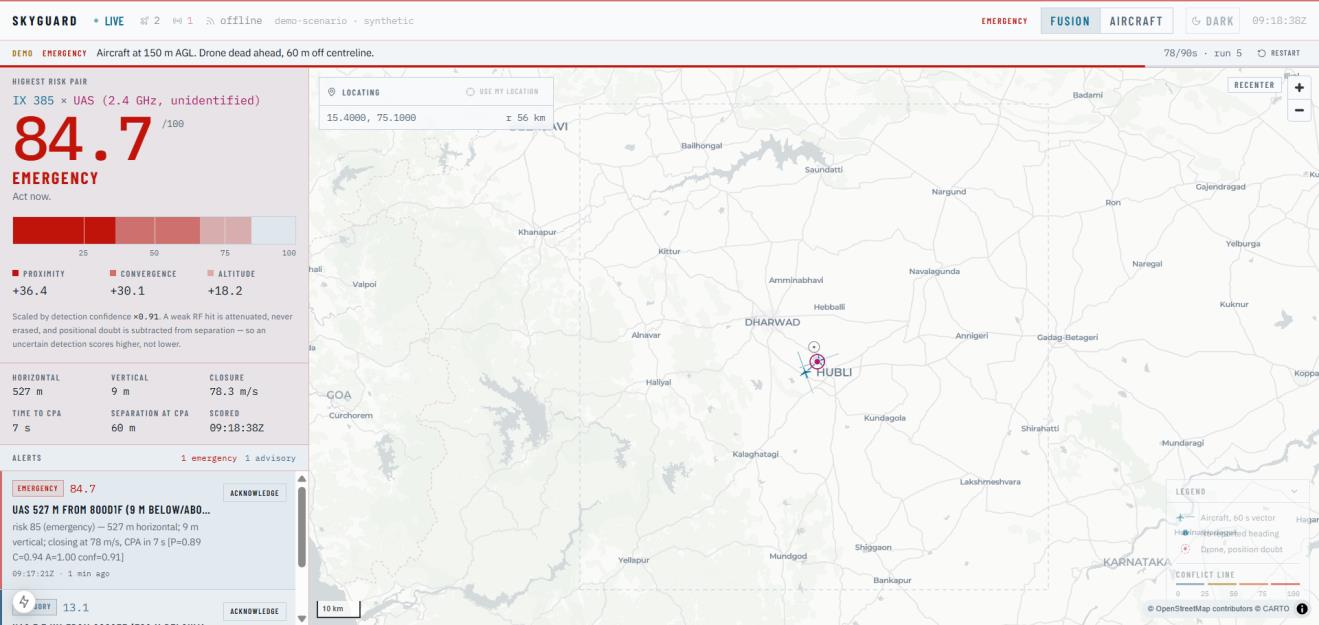
Table V lists two frames of the synthetic demonstration scenario, read from the dashboard readouts shown in Figs. 3 and 4. In both frames the contributions of the three terms sum to the displayed risk score, and the detection-confidence factor was 0.91.
Proximit Frame Convergence Altitude R Tier Horiz. sep. Time to CPA y Fig. 3 2.7 18.3 9.1 30.1 Caution 4.04 km 51 s Fig. 4 36.4 30.1 18.2 84.7 Emergency 527 m 7 s
Between the two frames the drone closes from about 4 km to 527 m while the closure rate stays near 78 m/s, so the proximity contribution rises from 2.7 to 36.4 and the convergence contribution from 18.3 to 30.1. The score therefore moves from the Caution tier (threshold 25) to the Emergency tier (threshold 75) as the encounter becomes more severe. These are single frames of a simulated scenario, not measurements from live sensors.
C. Sample Output
Fig. 3 shows the live risk map of the dashboard, and Fig. 4 shows the alert panel with the computed risk score. Alongside the score, the dashboard lists the contribution of each term, together with horizontal and vertical separation, closure rate and time to the closest point of approach.
D. Discussion and Limitations
Fusing ADS-B and RF detection data in one platform provides information that neither source can give alone. ADS-B shows where manned aircraft are but cannot see drones, while RF detection shows drones but cannot judge whether they threaten any aircraft. Th e weighted risk score links the two and converts raw detections into a single actionable number. The implemented score combines proximity, convergence and aircraft altitude-band severity, then scales the weighted sum by detection confidence. The system performs best when both inputs are available and up to date; trajectory prediction allows alerts to be raised before a drone enters the danger zone; and the modular design allows new sensor inputs to be added without changing the risk engine.
The system also has limitations. RF-based detection cannot see RF-silent drones (autonomous or fiber- optic controlled) [12]. ADS-B data can be spoofed, so it needs cross -validation, and RF-dense urban environments can raise false positives. In the current phase the drone RF input is simulated or dataset-based, so field performance with live sensors still has to be validated, and the term weights (0.45, 0.35, 0.20) and tier thresholds (25, 50, 75), which are based on safety reasoning, require tuning with real incident data. The prototype validation covers the geometric score terms on synthetic scenarios. Authorization status (Remote ID) and RF-behavior classification are not terms of the current score equation; they are treated as extensions whose end-to-end validation with live sensor and classifier outputs remains future work.
VI. CONCLUSION AND FUTURE WORK
SkyGuard demonstrates a practical software approach to a real and growing safety problem: manned aircraft and drones sharing the same airspace. Our study shows that current platforms either track manned aircraft or detect drones, but none combines both into a unified, real-time risk-scoring engine at an affordable cost. SkyGuard addresses this gap by fusing ADS -B aircraft data with RF-based UAV detection data, computing a weighted 0–100 risk score from proximity, convergence and aircraft altitude severity scaled by detection confidence, and presenting four-tier alerts on a live dashboard. The system is passive and detect- only, which keeps it legally compliant, and its modular design makes it easy to extend.
The current phase is limited to the software pipeline with simulated and dataset-based RF inputs. Future work includes: (i) hardware integration, namely an SDR-based ADS-B receiver (RTL-SDR or FlightAware Pro Stick Plus) for live 1090 MHz data, a wideband RF sensor (HackRF One) for 2.4/5.8 GHz detection, antennas and a Raspberry Pi 4 edge unit, with field trials to validate detection range and false-positive rates;
- multi-sensor fusion with acoustic sensors and thermal or optical cameras to detect RF-silent drones; (iii) integration with FAA UTM-style APIs, Remote ID services and ATC systems; (iv) scaling the risk engine to hundreds of simultaneous drones for swarm threats; (v) predictive threat models trained on historical incident data; (vi) a tamper-proof audit trail of detections and risk events, for example using a distributed ledger; and
- adding authorization and RF-behavior terms to the score once they are validated with live classifier output.
ACKNOWLEDGMENT
The authors thank the Management and Principal of Moodlakatte Institute of Technology, Kundapura, and the Head of the Department of Artificial Intelligence & Machine Learning for the facilities and support provided for this work.
REFERENCES
- Dedrone by Axon, “The state of airspace defense today and what’s next,” Operational Data Report, Sep. 2025.
- Federal Aviation Administration (FAA), “UAS traffic management (UTM) framework.” [Online]. Available: faa.gov/uas/advanced_operations/traffic_management
- Drone Warfare Analysis, “Counter-UAS 101: Radio frequency (RF) drone detection,” Jan. 2026.
- UAVHQ Research, “FAA Part 108: Complete guide to BVLOS drone operations,” 2026.
- CRFS, “RFeye wideband drone detection technology.” [Online]. Available: crfs.com/solutions/drone-detection
- Sentrycs/Ondas Holdings, “Version 6.0 release with Horizon Engine,” Nov. 2025.
- Robin Radar Systems, “10 types of counter-drone technology.” [Online]. Available: robinradar.com
- Unmanned Systems Technology, “Detect and avoid (DAA) systems overview,” Jan. 2026.
- “An effective RF-based solution for drone detection and recognition,” Springer Nature, Jan. 2025.
- “UAV operations safety assessment: A systematic literature review,” ACM Comput. Surv., 2025.
- GreyB Research, “Drone geofencing and airspace risk research,” Oct. 2025.
- The Drone Girl, “Why 80% of drone detection systems are now obsolete,” Sep. 2025.
© 2026 The Author(s). Open access under the Creative Commons Attribution 4.0 International License (CC BY 4.0). This HTML text was made from the published PDF so it can be read on any device; the PDF is the version of record. A figure or table that could not be reproduced exactly here links to its page in the PDF.